
Top Data Analysis Tools For STEM Research Projects
Top Data Analysis Tools For STEM Research Projects A crucial part of STEM (science, technology, engineering, and mathematics) research is data analysis. Tools for organizing, processing, and interpreting data can make the difference between making incorrect conclusions and finding important insights in any scientific or engineering project.
Having the appropriate tools to analyze and show data is essential for researchers in STEM subjects because of the large volume of data they deal with. Some of the greatest resources for data analysis in STEM research projects are examined in this article.
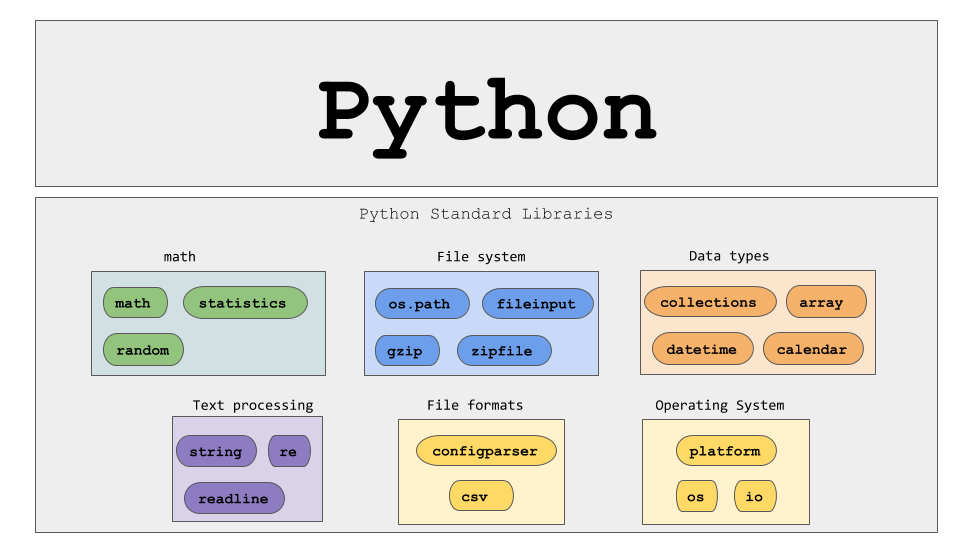
1. Python and Its Libraries
Python is one of the most popular programming languages in the world, especially for data analysis. It is known for its simplicity, readability, and versatility. Python has a rich ecosystem of libraries tailored for data analysis, which makes it indispensable for STEM researchers.
Key Libraries in Python for Data Analysis:
- Pandas: For handling and manipulating structured data, including time-series data.
- NumPy: For performing numerical computations, such as matrix operations and complex mathematical functions.
- Matplotlib and Seaborn: These libraries are used for creating a wide range of static, animated, and interactive visualizations.
- SciPy: Useful for scientific and technical computing, including optimization, integration, and statistical analysis.
- Scikit-learn: A powerful machine learning library that provides a variety of algorithms for classification, regression, and clustering.
- TensorFlow and PyTorch: Leading libraries for deep learning applications.
Python’s integration with other platforms and systems, combined with its ease of use, makes it a top choice for STEM researchers working on data-heavy projects.
2. R and RStudio
R is another powerful tool widely used in STEM research, particularly in fields involving statistics and data visualization. It is well-suited for complex statistical analyses and data mining tasks. R’s extensive package ecosystem allows researchers to extend its functionality for specific types of analyses.
R Features for Data Analysis:
- Statistical Analysis: R has built-in support for a wide range of statistical methods, from basic descriptive statistics to advanced multivariate analysis.
- Data Visualization: R’s ggplot2 package is renowned for its data visualization capabilities, providing highly customizable plots and graphs.
- Packages for Specific Disciplines: Researchers can find specific packages for genomics, bioinformatics, econometrics, and other fields, which makes R highly adaptable for specialized research projects.
RStudio, an integrated development environment (IDE) for R, enhances the user experience with features like syntax highlighting, debugging, and visualization tools.
3. MATLAB
MATLAB is a proprietary programming language and environment used extensively in engineering and scientific fields for numerical computing. It is particularly powerful for matrix manipulations, simulations, and algorithm development, making it ideal for researchers working in fields like physics, engineering, and finance.
MATLAB Features:
- Numerical Computing: MATLAB excels at matrix operations, numerical optimization, and solving differential equations.
- Simulink: A MATLAB extension, Simulink is used for modeling, simulating, and analyzing dynamic systems. It is commonly used in control systems, signal processing, and system design.
- Toolboxes for Specific Fields: MATLAB offers specialized toolboxes for various disciplines, including control systems, statistics, machine learning, and bioinformatics.
- Visualization: MATLAB’s robust visualization capabilities allow for detailed 2D and 3D plots.
MATLAB’s primary advantage is its user-friendly interface and extensive documentation, making it a powerful tool for STEM professionals, even those who are not experienced programmers.
4. Tableau
Tableau is a leading data visualization tool used widely for analyzing and presenting data in an interactive format. Its ease of use and powerful visual capabilities make it an excellent tool for STEM researchers who need to communicate complex data insights effectively.
Key Features of Tableau:
- Drag-and-Drop Interface: Allows users to create visualizations with minimal coding, making it accessible to non-programmers.
- Integration with Multiple Data Sources: Tableau supports a wide range of data formats and can integrate with databases, cloud services, and spreadsheets.
- Advanced Visual Analytics: Users can create interactive dashboards, heat maps, scatter plots, and more to explore patterns and trends in the data.
- Real-Time Data Analysis: Tableau enables real-time data visualization, making it ideal for monitoring live data streams in research projects.
While Tableau is often used in business and marketing, its ability to handle complex datasets makes it a valuable tool for STEM research as well.
5. SQL and Databases
Structured Query Language (SQL) is a standard programming language for managing and querying relational databases. SQL is used to retrieve, insert, update, and delete data from databases, making it a fundamental tool for managing large datasets.
SQL in STEM Research:
- Data Management: SQL is essential for managing large datasets, ensuring efficient storage and retrieval of data.
- Data Querying: Researchers can use SQL to filter, aggregate, and join data from multiple tables, allowing them to extract meaningful insights.
- Data Security and Integrity: SQL databases ensure that data is stored securely and that its integrity is maintained over time.
While SQL itself is a tool for querying databases, it is often used in combination with other tools like Python or R to perform more complex analyses.
6. Excel
Microsoft Excel is a widely used spreadsheet application that offers powerful features for data analysis. While it might not be as advanced as Python or R for large-scale data analysis, Excel is still an indispensable tool for quick analysis and smaller datasets.
Excel Features:
- Data Sorting and Filtering: Excel makes it easy to sort, filter, and manipulate data.
- Pivot Tables: Pivot tables allow users to summarize large datasets and perform complex aggregations.
- Formulas and Functions: Excel offers a wide array of built-in functions for statistical analysis, mathematical operations, and data manipulation.
- Visualization Tools: Excel provides basic charts and graphs, including bar, line, and scatter plots.
Excel is particularly useful for quickly testing hypotheses and working with datasets that are not too large. It is often used in combination with more advanced tools for larger-scale analysis.
7. Google Sheets
Google Sheets is a cloud-based alternative to Microsoft Excel, offering similar functionality but with the added benefit of real-time collaboration. It is ideal for team-based STEM research projects, especially for those working remotely.
Key Features of Google Sheets:
- Cloud Integration: Google Sheets automatically saves your work in the cloud, making it accessible from any device with an internet connection.
- Real-Time Collaboration: Multiple users can work on the same document simultaneously, making it perfect for group projects.
- Data Visualization: Like Excel, Google Sheets allows users to create various types of charts and graphs to visualize data.
While not as feature-rich as Excel, Google Sheets can be an excellent tool for collaborative research projects and quick data analysis.
8. Power BI
Power BI is a business analytics tool from Microsoft that is increasingly being used for research and data analysis in STEM fields. Like Tableau, Power BI excels at transforming raw data into meaningful visual insights.
Key Features of Power BI:
- Data Integration: Power BI integrates seamlessly with a wide variety of data sources, including databases, cloud services, and flat files.
- Interactive Dashboards: Researchers can create interactive dashboards that allow users to drill down into specific data points.
- Advanced Analytics: Power BI supports advanced features like machine learning integration and custom analytics.
Power BI is suitable for STEM researchers who need to share their findings with a wider audience through interactive data visualizations.

Conclusion
Data interpretation and the creation of fresh ideas in STEM research are greatly aided by the data analysis tools. The correct tool may greatly increase the effectiveness and efficiency of any operation, whether you’re working with big datasets, running intricate simulations, or showing research findings.
While MATLAB and Tableau provide strong tools for specialized study domains, Python and R are best suited for statistical work and in-depth analysis. While cloud-based technologies like Google Sheets and Power BI facilitate collaboration and real-time analysis, SQL and Excel are still essential for organizing and querying data in data management.
Your unique needs, the intricacy of the data, and the kind of analysis you intend to perform will ultimately determine which tool is appropriate for your STEM research project. You may increase the impact of your study and improve the accuracy of your findings by using the appropriate instrument.
(FAQ)
1. What is the best tool for data analysis in STEM?
The best tool depends on the nature of the project. Python, R, and MATLAB are excellent for advanced analysis, while Tableau and Power BI are ideal for data visualization and reporting. SQL is essential for managing large datasets, and Excel/Google Sheets are great for basic analysis and collaboration.
2. Is Python better than R for data analysis?
Both Python and R are powerful for data analysis. Python is more versatile and widely used across different domains, while R excels in statistical analysis and visualization. The choice depends on your research needs and personal preference.
3. Can I use Excel for large datasets in STEM research?
While Excel is a great tool for smaller datasets, it is not suitable for large-scale data analysis due to limitations in processing power. For large datasets, consider using tools like Python, R, or SQL.
4. How do I choose between Tableau and Power BI?
Both tools are excellent for data visualization. Tableau offers superior visualization flexibility, while Power BI is often preferred by users already within the Microsoft ecosystem and is better for integration with other Microsoft tools.
5. Are there free alternatives to MATLAB?
Yes, Python and Octave are open-source alternatives to MATLAB, offering similar functionality for numerical analysis, simulations, and algorithm development.
Read More :


