Table of Contents
ToggleIntroduction
The Importance Of Data Analysis In UPSC Mains GS Paper 3 The UPSC Mains General Studies Paper 3 (GS Paper 3) is a crucial paper in the examination, focusing on Technology, Economic Development, Environmental Conservation, Security, and Disaster Management. As we move towards UPSC 2025, the examination is evolving, and one of the most significant trends is the increasing emphasis on data analysis in evaluating and presenting answers. The integration of data into written responses is no longer just a skill but a necessity for aspirants to demonstrate analytical depth, relevance, and understanding.
The importance of data analysis in GS Paper 3 is paramount for several reasons. With the growing volume of information available through reports, surveys, government data, and international databases, UPSC demands that candidates do more than just provide descriptive answers. They need to interpret and present data in a coherent manner that substantiates their argument and enhances the quality of their responses.
1. Understanding the Relevance of Data Analysis in GS Paper 3
1.1. What is Data Analysis in the Context of GS Paper 3?
In the context of GS Paper 3, data analysis refers to the process of interpreting quantitative and qualitative information and using it to support arguments, conclusions, or solutions to the questions posed. The data could be in the form of:
- Statistical figures (e.g., GDP growth, inflation rates, population figures, unemployment data, etc.)
- Graphs, charts, and tables from government reports or international organizations.
- Trends and patterns observed in various sectors like economy, security, and environment.
- Case studies or real-time examples backed by data.
Data analysis involves critical thinking, pattern recognition, and the ability to draw insights from complex information to create an informed narrative in your answers.
1.2. Why is Data Analysis Important for UPSC GS Paper 3?
- Enhances Answer Quality: In GS Paper 3, you are expected to provide more than just theoretical knowledge. The inclusion of data-driven insights adds credibility and depth to your answers. It showcases your ability to understand the subject matter with empirical evidence.
- Demonstrates Analytical Ability: The UPSC exam tests not only your factual knowledge but also your ability to analyze and synthesize information. Proper data analysis indicates a high level of comprehension and intellectual capability.
- Supports Arguments and Opinions: In many questions, especially those dealing with economic policies, security issues, or environmental concerns, your opinion needs to be backed by data to make it convincing. For instance, if discussing the success or failure of a government policy, citing relevant data can highlight its effectiveness.
- Helps in Structuring Answers: Data can serve as proof points to structure your answer in a more logical and coherent manner, making your argument stronger and clearer.
- Illustrates Real-World Relevance: UPSC encourages candidates to relate their answers to real-life applications. The ability to use data to substantiate your answer showcases the practical relevance of your understanding.
2. Types of Data in GS Paper 3 and How to Use Them
2.1. Economic Data
In GS Paper 3, economic growth is a recurring theme. Questions often revolve around policies, fiscal or monetary actions, and economic trends. Using relevant economic data helps illustrate the success or failure of policies.
- GDP Growth Rates: You should be able to analyze India’s GDP growth or sector-wise growth figures and interpret trends (such as periods of recession or boom) and the factors behind them.
- Inflation and Unemployment Rates: These indicators are central to economic debates and can be used to show how different sectors of the economy have performed. Additionally, data on poverty rates, income inequality, and labor force participation can support arguments on economic disparities.
- Government Schemes: Data on the performance of schemes like PMAY, MNREGA, and Make in India helps evaluate their success or shortcomings. Comparative data over time will demonstrate the long-term impact of these policies.
2.2. Environmental Data
Environmental issues such as climate change, pollution, and resource conservation are critical in GS Paper 3. Here, data plays a significant role in demonstrating causal relationships and presenting solutions.
- Carbon Emissions: Statistical data related to carbon footprints and emissions can help answer questions related to India’s role in climate change negotiations (e.g., the Paris Agreement).
- Water Resources and Conservation: Data on water availability, usage, and depletion rates are frequently required to address issues like water scarcity, river linking, and sustainable water management.
- Biodiversity and Forest Cover: Use data from sources like the Forest Survey of India to discuss trends in forest cover, wildlife population, and the effectiveness of conservation strategies.
2.3. Security Data
Internal security issues such as Naxalism, terrorism, and border security frequently appear in the GS Paper 3. Data here can support your discussion on the effectiveness of security policies and the scale of the problem.
- Incidents of Terrorism and Violence: Statistics on terrorism-related incidents, casualties, and areas of frequent violence can help support arguments about the security situation in various regions.
- Expenditure on Defense: Understanding defense budgets, procurement figures, and military spending patterns is essential to address questions on defense preparedness and the need for modernization.
Read more
2.4. Technological Data
Data related to technological advancements, particularly in fields like space exploration, artificial intelligence, and renewable energy, is becoming increasingly important.
- Technological Innovations: Data on technological innovations, patents, research funding, and advancements in AI, nanotechnology, and renewable energy can be used to demonstrate India’s position in global technology rankings.
- Infrastructure Data: Data on infrastructure projects like smart cities, high-speed rail, and telecommunications can be crucial to answering questions related to economic development and urbanization.
2.5. Disaster Management Data
Disasters, both natural and man-made, are prominent in GS Paper 3. Here, data on the frequency, impact, and response measures are crucial to analyze the effectiveness of India’s disaster management frameworks.
- Natural Disasters: Use data on the frequency of floods, cyclones, earthquakes, and droughts, including their economic impacts, to assess India’s preparedness.
- Humanitarian Assistance: Statistical data related to relief operations, recovery timelines, and the allocation of resources can serve as a measure of the effectiveness of disaster management policies.

3. How to Incorporate Data into Your Answers
3.1. Presenting Data Effectively
While data is essential, its presentation is equally important. Here are a few ways to ensure clarity in your answers:
- Use Bullet Points: When presenting data, use bullet points or numbered lists for better organization.
- Avoid Overloading: Don’t overwhelm your answers with too much data. Select the most relevant and impactful data that supports your argument.
- Simplify Complex Data: If you’re discussing complex statistical data, provide context or interpretations to make it understandable to the examiner.
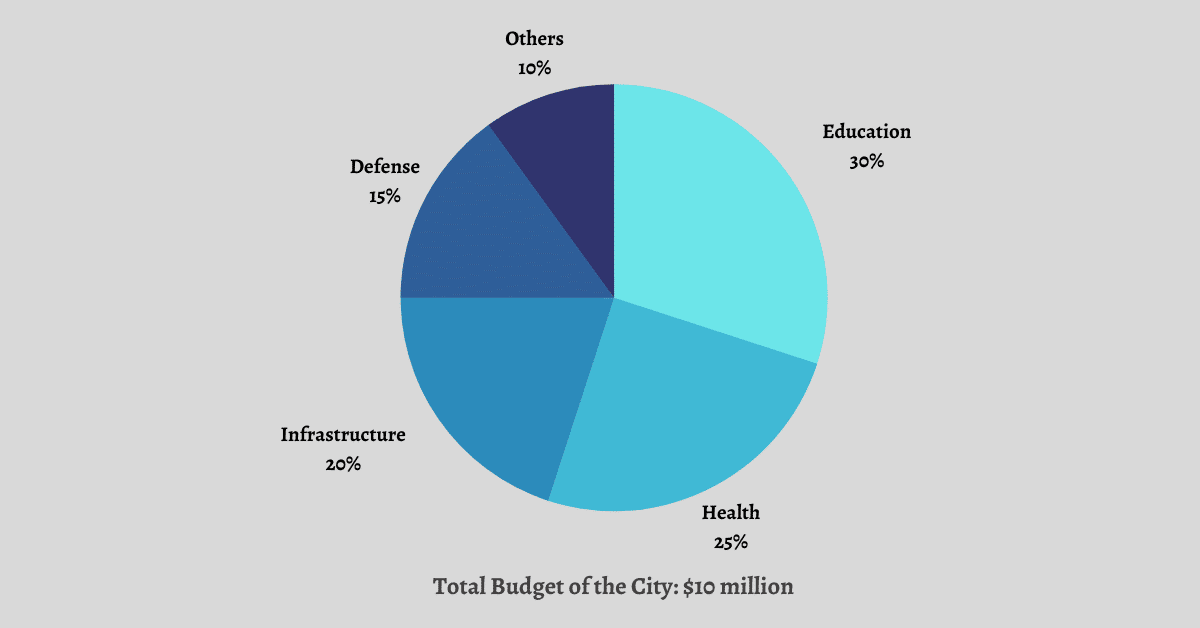
- Graphical Representation: If the question demands it, representing data in the form of a table, graph, or chart can be an excellent way to showcase your analytical skills.
Read more
3.2. Data Interpretation
Interpreting data effectively requires you to:
- Highlight Trends: Discuss trends over time, such as improvements in economic indicators or environmental conservation efforts.
- Identify Relationships: Correlate data with government policies. For instance, if discussing the success of a welfare scheme, point to data showing increased enrollment or outcomes.
- Provide Solutions: After presenting data, link it to potential solutions. For example, in environmental questions, use data on pollution levels to propose methods for sustainable urban planning.

Conclusion
Mastering data analysis for UPSC GS Paper 3 in 2025 will be an invaluable skill for aspirants. In today’s competitive landscape, where information is abundant and the demand for analytical thinking is ever-growing, the ability to interpret and present data effectively can significantly enhance the quality of your answers. By focusing on relevant datasets, practicing interpretation skills, and learning how to incorporate data seamlessly into your responses, you can effectively tackle a wide range of questions in this critical paper.
Read more
FAQs
1. How can I practice data analysis for UPSC GS Paper 3?
Start by reading and interpreting government reports, economic surveys, and relevant data from sources like Planning Commission and NITI Aayog. Practice incorporating data into sample answers.
2. What types of data should I focus on for UPSC GS Paper 3?
Focus on data related to economic growth, environmental statistics, security incidents, and technological innovations. Data from national and international organizations like the World Bank, IMF, and UNEP is invaluable.
3. How can I integrate data without overwhelming my answer?
Be concise. Use relevant data and avoid over-explaining. Present data in bullet points and follow it with an analysis that ties the information back to the question.
4. Is it necessary to include data in every answer?
No, not in every answer. Use data only when it strengthens your argument. In some cases, a well-reasoned theoretical answer may suffice, but data can enhance your credibility.
5. Where can I find reliable data for UPSC GS Paper 3?
Use official sources such as the Ministry of Statistics and Programme Implementation, Economic Survey, India’s Annual Report, and databases like World Bank, IMF, and UNDP.
Read more


